Visual Artifacts in Data Analysis

It’s difficult to overestimate the value of visualization in data analysis. Visual representations of data should not be considered the results of an analysis process, but rather the essential tools and methods that should be applied at every stage of working with data. When dealing with specific data and questions, we often find it useful to add non-standard visual elements that are adapted to characteristics of the data, goals of analysis tasks or individual and organizational requirements. We refer to such new elements as analysis artifacts, which can be defined as visual products of analysis methods, general or specific for domain and scenario, providing additional context for the results or the analysis process. There may be various goals identified for specific analysis artifacts, but their general role is to make the analysis user experience more accessible, adaptable and available.

Analysis artifacts can take many forms, from text elements, through supplementary data series, to new custom shapes and visual constructs. The simplest example are contextual text annotations, often automatically added, with details regarding the data or the process (see example). Some analysis artifacts are generic as they address data properties, like the cyclical or seasonal nature of a time series, patterns and trends (e.g. rent case study), outliers and anomalies or differences and similarities against population data. Some others are specific for a domain and/or type of an analysis task, and may be closely integrated with methods implemented in related analysis templates. In practice, we can think about different types of analysis artifacts in terms of tasks used in analysis decision support

  • SUMMARIZE the structure and quality of data, results of analysis or execution of the process
  • EXPLAIN applied analysis methods, identified patterns, trends or other interesting discoveries
  • GUIDE through the next available and recommended steps at given point of the analysis process
  • INTEGRATE the data from different sources and the results from different methods and agents
  • RELATE the results, data points, data series, big picture context, and input from different users
  • EXPLORE anomalies, changes, hypothesizes and opportunities for experimentation or side questions

Figure 1 includes an example of domain and scenario specific analysis artifact (INTEGRATE type) for stock market transactions. This artifact illustrates a single purchase of stock and subsequent sales, using historical quotes as the background. For each sale event, the information about number of sold stock, their value and gain/loss are included.

Figure 1. Analysis artifact for stock transactions, with a single purchase and multiple sales events (SVG)

Figure 1. Analysis artifact for stock transactions, with a single purchase and multiple sales events (SVG)

Analysis artifacts can be considered means for adaptation of analysis experience to the context of analysis tasks and user’s needs, requirements and preferences. They can be highly customized and personalized, leading to adaptive user experiences that are more effective and efficient in the scope of controlling the analysis processes and interpreting the results. These capabilities make analysis artifacts very powerful tools for complex decision problems and situations. They can be very useful in dealing with imperfect data, potential information overflow, operating under strong external requirements (e.g. time constraints) or in configurations with multiple participants and incompatible goals and priorities. We found that they can be also helpful beyond visualization, as the artifact-related data structures can become subjects of analysis or be applied in a completely different scope or a different scenario.

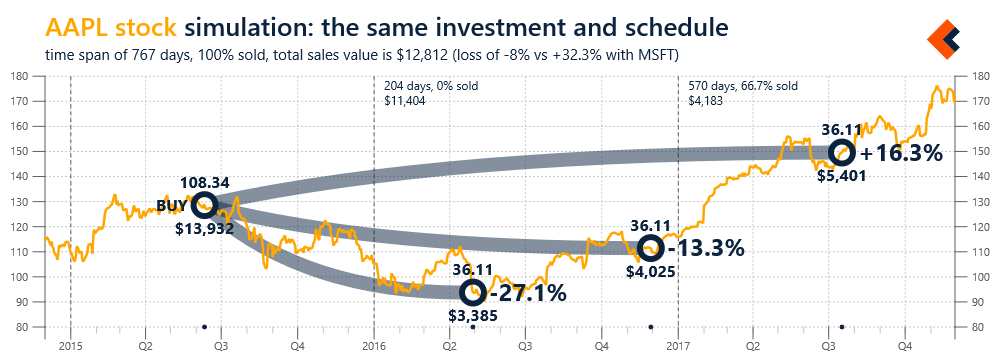
For example, Figure 2 presents a simple simulation based on the analysis artifact presented in Figure 1. The data structure related to that artifact are used here to illustrate a hypothetical scenario of investing the same amount of money in a different stock and following the same exact sales schedule (selling the same percentage of stock at each time point).

Figure 2. Simulation of the purchase and sell transactions from Figure 1 applied to a different stock (SVG, 2, 3)

Figure 2. Simulation of the purchase and sell transactions from Figure 1 applied to a different stock (SVG, 2, 3)

We think about visualization of our data as merely a canvas upon which we can paint specialized and personalized artifacts from our analysis processes. These artifacts can be applied not only in the scope of individual charts, but also for interactive decision workflows, based on multiple data sources, that may require many integrated visualizations in order to provide a sufficient context for a decision maker. This is especially important for data analysis in social context, with advanced collaboration scenarios involving multiple human participants and AI agents. As the complexity of algorithms and models is increasing, we need to provide significantly more user-friendly analysis environments for expanding number and variety of users. Multimodal interactions and technologies for virtual or mixed reality have great potential, but the best way to deal with complexity is to focus on simplicity. Analysis artifacts seem to be natural approach to that challenge and they should lead us to brand new types of data analysis experiences, which may soon be necessities, not just opportunities.

Data analysis in social context

In the previous blog post we talked about the social context of our decision-making processes. We used the example from the healthcare domain to show that decision making these days rarely occurs in isolation and that technical solutions aimed at supporting these processes need to become essentially social. In this post, we will take a step further and talk a bit about designing data analysis solutions to be effective and useful in social and business contexts. These contexts are dynamic and usually more complex that they might seem. They include multiple elements, roles, types of relationships and structures; can be designed and constructed, or grown organically; can exist continuously in background (everybody has multiple ones) or have a short lifespan tied to a specific purpose or situation. Such diverse characteristics can result in completely different functional requirements, what means for data analysis solutions that they need to be very flexible and adaptable.

Data analysis in social context is about sharing, but not only of data and results, but also of efforts, skills, experiences, and - probably the most important here – different points of view. There are some technical elements that are common in all such solutions, including efficient  data exchange that enables natural and smooth interactions, navigation through complex data spaces, and management of relationships (sometimes completely new types). We can also try to identify some higher-level principles that help with building effective and useful solutions for various social contexts:

  • Focus is on users as the centers of social contexts. This starts with a personal user experience and need for understanding individual requirements and preferences. But it can quickly get even more difficult, if we have multiple users with incompatible or conflicting goals. There is a need for clarity (do these agents really operate according to my priorities?) and transparency (who can access data or control the process?). In many situations, analysis decision support may include defining contract-based goals and rules of data analysis efforts (e.g. solving a specific problem).
  • Data analysis processes are distributed efforts. The scope of data analysis in social context expands from an individual, into groups, communities and eventually societies. This requires effective interactions between multiple participants, both human and agents, across shared data spaces. Here the requirements can be very different and a solution must support various scenarios covering cooperation, negotiations or competition. There can be also the challenges of integrating individual experiences (each with possibly different presentation) into consistent group communication system.
  • Data analysis process is usually part of a bigger system. Problems and contexts are unique; types of tasks, best practices, patterns and challenges are more general. A data analysis process can benefit from similar external projects (e.g. for population big picture) and contribute to them (with anonymized data). There are opportunities for sharing competencies, efforts and solutions even externally, in open, research or commercial frameworks. However, integration scenarios require very clear consistent rules and transparency regarding privacy, security or ownership of information.
  • Intelligent agents can be essential participants of data analysis. Interactions during analysis or decision making process can take place in networks of human and non-human actors. Intelligent agents can be interactive participants, sharing information with users or performing specific tasks per request. They can also operate in the background, monitoring actions, conversations or external events, and acting when it is needed or useful. In group scenarios, they may take special roles, like optimizing of efforts, balancing the structure, or mediating with odd or even number of agents.

Let’s take a quick look at that last point, as it seems to be the clearest illustration of relationships between technology and social contexts. We will reuse the example from the healthcare domain, introduced in our previous blog post, which shows relationships between a patient’s context (family and friends) and the physician’s context (professional medical network). Figure 1 presents that structure, with the addition of new connections involving intelligent agents, some interactive and others operating in the background. Interactive agents can provide direct assistance and support to patients, their friends and families, along with connections to the medical side, where different types of agents can help with coordination of efforts and collaboration in medical analysis. Background agents can enable various scenarios, like continuous remote monitoring (not only in the scope of physiological metrics), integration with population efforts (connecting physicians working on similar cases) or automatic documentation of decision processes.

Figure 1. An example of a social structure in healthcare combining humans and intelligent agents

Figure 1. An example of a social structure in healthcare combining humans and intelligent agents

Similar scenarios may seem distant, but they are already here, although usually in simpler configurations with a bot or a digital assistant as front-end to a realm of specific services. In the scope of data analysis, including a social context is a natural consequence of focusing on the user’s goals, needs and preferences. In our framework, this focus starts with personalized user experiences based on individual choices and activities. For groups scenarios, it is expanded to also include the user’s role, relationships and characteristics of a social or business context. At this point data analysis is no longer only about sharing, but also about communication and conversations embedded in a shared data space. Intelligent agents can fit in such spaces very naturally and become the key participants. An agent can interact with users, change their behaviors or even become an active driver of interactions between different users and agents. The result is a completely new social structure - technology is not only capable of adopting to a social context, but may shape it or, in some cases, construct it.

Human elements will long remain fundamental in solving real problems and there are great opportunities for solutions facilitating cooperation in complex scenarios. There are situations, where enabling efficient cooperation may actually be more important than selecting the right algorithms and analysis techniques. The data analysis solutions must however be designed for social and business contexts, with clear rules and transparency, always close to users and actively addressing challenges like possible incompatibilities in priorities between individuals or an individual and a group. Including social context in data analysis is becoming however unavoidable, due in part to the increasing popularity of conversation-based interactions. And with the application of intelligent agents, social context is added to all data analysis projects, even those conducted by a single user.

Social context of decision process

Our primary motivations for building data analysis solutions are to help with real problems and to make meaningful impacts. Solving a problem is all about decisions, sometimes a single big one, often a sequence of small steps leading to a preferable outcome. Data analysis software should help make better decisions, based on available data, in a timely manner and using natural experience. Some problems are isolated and solving them requires an individual exploration of vast data spaces – by a single user and with a single set of needs, requirements and preferences. However, in our digital reality, this is rarely the case in practice, as decision making processes usually occur in a social context. That context is based on a social structure of individuals (involved in solving a problem or affected by the solution), but it also includes other components like data sources, available analysis methods and, more and more often, intelligent agents that can actively participate in the decision process.

The relevance of a social context in decision making is the most visible in healthcare, which is currently going through a digital revolution. With all new data that can be processed and the application of advanced algorithms, healthcare is becoming more data-driven at all stages, including disease prevention, diagnosis and treatment. Different forms of data analysis improve the effectiveness and efficiency of decision processes and become key foundations for the next generations of health care. But with successful automation of specific tasks the importance of human elements only increases. There is obviously a focus on the patient, as health care becomes more personalized, with customization of a process and of the medications (pharmacogenomics). A lot of attention is also given to physicians, due to complexity and non-deterministic nature of this domain and the very high potential cost of an error. But it is still not enough, as success in health care critically depends on partnerships and collaborative relationships.

Social context in health care is built upon the relationship between patients and physicians. These relationships are no longer 1-to-1, nor symmetrical, as social structures on both sides usually include multiple participants. On the patient’s side, this is primarily a social network providing support and influence with dynamics that can get easily complex, especially in scenarios when patients cannot take control over their health (e.g. children or elderly persons). On the physician’s side, there is a virtual team of medical professionals working with the patient; the physician should be the trusted point of contact, but the process can now expand beyond the knowledge and experience of any individual. Social context in health care is unique -  for example we may assume that all participants in the decision process share the same goal, i.e. well-being of the patient. But this means that there are also unique functional requirements for these relationships to work: they must be designed for a long term, simple and convenient on a daily basis, when there are no major problems, but also efficient and natural in case of a serious medical condition or an emergency.

Figure 1 includes a simple social structure built around the traditional relationship between a patient and a physician as its core. This is just a proof of concept, but similar models for real case studies can be created in various ways: defined a priori (e.g. by roles in a team), constructed based on provided information (e.g. key actors), or automatically generated using records of interactions.

Figure 1. An example of a social structure from a context of decision processes in health care

Figure 1. An example of a social structure from a context of decision processes in health care

The models for actual social structures and contexts are obviously dynamic and specific to a situation. That, in addition to possible complexity, makes the functional requirements for the quality of the relationships very hard to meet. In order to be successful in domains likes healthcare, technology must be designed and implemented for the social contexts of their applications. This starts with strong generic fundamentals like secure and reliable data processing, natural experiences, or smooth integration with external components. But this is only the beginning if we want to facilitate efficient cooperation (which can be more important than actual data analysis itself), enable building trust and partnership or help with challenges, emotional factors (e.g. fear) and certain behaviors (e.g. avoidance). Such scenarios require a functionality of relationship management, what means that social context must be taken into consideration at each and every stage of creating software - this is no longer another feature, but rather it becomes one of the core fundamentals.

Let’s take a brief look at the seemingly straightforward requirement of keeping participants of a decision process informed. This means, among other things, that the results of data analysis must be useful for the user. However, with a social context, we have multiple users, with individual needs, requirements and preferences. Each of them needs a different type of story -  even the same information should be presented differently to a physician (all the details with analysis decision support) and to a patient (explanations with option of learning more or starting a conversation). One of the features we’re developing in our framework is designed to provide personalized views of shared data space to multiple users and roles of a social structure (for example a company). Personalized user experience is based on individual preferences, but also on analysis of the user’s role, profile (e.g. age for accessibility), the nature of the task/scenario as well as any situational requirements (e.g. pressure due to an emergency). Figure 2 shows possible functional templates of personalized user experience for key users in our example.

Figure 2. Personalized user experiences in a social structure of decision processes in health care

Figure 2. Personalized user experiences in a social structure of decision processes in health care

In this post, we used healthcare as the application domain. In this domain, we can see that technology has the potential to improve existing processes and practices but, at the same time, it will change them dramatically. Modern data analysis solutions will not replace physicians, but they will change behavioral patterns of interactions between patients and physicians (and likely beyond). Obviously, healthcare is about people and relationships more than other domains are. But since social context is so essential for our decision processes, we may expect similar changes in other domains affected by democratization of data analysis.  Data analysis is becoming social following the path from data connecting users, through natural interactions and cooperation, to relationships focused on very specific challenges. Social contexts will become even more relevant as we start implementing scenarios involving intelligent software agents that can participate in our decision processes. With that change, we are no longer only adapting to a social context, we are actually trying to shape it.

Playing in the data pond

While talking about multiple data streams in the earlier posts of this series, we started using a term “data pond”. This is a concept we’re using internally in the context processing sets of streams, of the same or different types, that are usually somehow related - by source (e.g. a specific user or organization), domain (e.g. records from different patients) or processing requirements (e.g. data cannot be stored in cloud). Data ponds are very useful for simplification of data management, for example, in a basic scenario, adding a new stream to a project may require only dropping a file at a specific location. They are however also essential for analysis templates - sequences of transformations and analysis methods (generic or domain specific) that can be applied to streams in a pond.

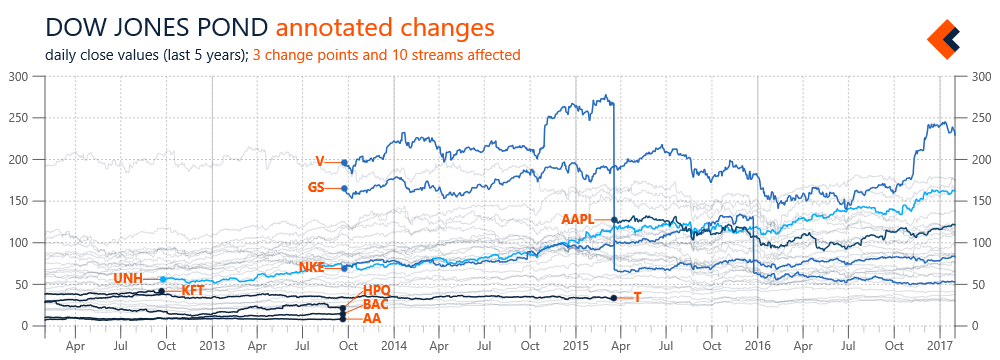
Figure 1 illustrates an example of streams automatically added to, and removed from, a data pond. Again, we’re using streams with daily close prices of Dow Jones components. In this case, information about changing the stocks included in Dow Jones are added to a definition of the pond and our framework automatically includes appropriate data streams, with applicable time constraints (so we don’t have to directly edit streams). However, the scope of a pond doesn’t need to be predefined; it can be also automatically determined based on availability of data streams in associated data sources. Monitoring the state of a pond can be further expanded with custom rules (e.g. tracking updates’ frequency) that result in chart annotations or notifications from the framework.

Figure 1 Overview of changes in the list of Dow Jones components with automated change annotations (SVG)

Figure 1 Overview of changes in the list of Dow Jones components with automated change annotations (SVG)

Data ponds are not only useful for data management, they are also relevant for analysis templates, which can be executed on individual streams or on a data pond as a whole. Analysis templates can be applied by default during the importing phase, and include normalization, error detection or input validation. They may also be executed conditionally, based on specific events or the nature of data streams. For example, the prices in Figure 1 were not processed, and the changes due to stock splits are clearly visible (see V or NKE). A stream with information about such events was added to a pond’s definition and used to trigger a template for all affected stocks. The result is a new series with split adjusted prices calculated for use in a chart with percentage changes (Figure 2).

Figure 2 Example of an analysis template automatically applied to calculating split adjusted stock price (SVG)

Figure 2 Example of an analysis template automatically applied to calculating split adjusted stock price (SVG)

Data streams about Dow Jones components are obviously just a simple example, but this case study can be easily adopted to more practical applications like analysis of individual stock portfolio (with sells and buys defining the scope). We find data ponds, and visualizations based on them, useful in different scenarios and types of streams: records from multiple points of sale, results from repeated research experiments, and logs from hierarchically organized server nodes. Data ponds can be used to improve the management of input data, with detection of new streams and application of initial transformations, but also to give more control over the scope and context of a data analysis. This is especially important for long-term or continuous projects (e.g. building more complex models) and enables interesting scenarios like private analysis spaces, where specific requirements, including security, need to be met.

Foreground vs background

In the previous blog post we looked at the processing of multiple data streams and using the resulting sets of data (referred as data ponds) as subjects of data analysis. This is often an effective approach to help with understanding specific phenomena, as a big-picture created from a number of series can reveal trends and patterns. Such a big-picture can however serve additional purposes, as it also can be used to establish a relevant context for the processing of an individual stream (that may, but doesn’t have to, be part of the data used to create this context). The results from analysis templates implementing such an approach can be effectively visualized, with focus on the individual series as a clearly distinguished foreground and context from multiple series presented as a background.

In the examples below we again use Dow Jones components, this time with the 5-year history of their daily close prices. Figure 1 includes data series for all stocks in the scope of Dow Jones data pond, without any transformations applied and with focus on Microsoft (MSFT).

Figure 1. Five-year history of Dow Jones components with focus on Microsoft stock daily close prices (SVG)

Figure 1. Five-year history of Dow Jones components with focus on Microsoft stock daily close prices (SVG)

This chart is not very useful, since the value range of MSFT price is small compared to the value range of the chart (determined by all series) and thus the foreground series seems rather flat. This problem can be addressed by transforming all the series in the data pond, as illustrated in Figure 2, where series’ value ranges were normalized to [0, 1] (we used this transformation also in the first post of the series).

Figure 2. Dow Jones background with value ranges normalized to [0,1] and Microsoft stock as the foreground (SVG)


Figure 2. Dow Jones background with value ranges normalized to [0,1] and Microsoft stock as the foreground (SVG)

Another type of transformation, often applied in practice, is based on calculating change from a previous value, or one at a selected point in time. Figure 3 includes results of such an experiment with the change (percentage) calculated against the first data point in the time frame (5 years earlier). In addition to MSFT stock, this chart also covers IBM, so that their performance can be easily compared.

Figure 3. Price changes (%) of Microsoft and IBM stock over 5-year interval with Dow Jones components background (SVG)

Figure 3. Price changes (%) of Microsoft and IBM stock over 5-year interval with Dow Jones components background (SVG)

In the examples above we focused on the visualization of individual series against the context built from multiple series. But obviously, the foreground-vs-background pattern can also be used for analysis, as the focus series can be analyzed in the context of all the others. Such analysis doesn’t have to be limited to a single series, but can focus on a subset, e.g. patients meeting specified criteria. The context build from multiple series may also be of different types - it can be personal (e.g. latest workout metrics vs results collected over time), local (e.g. sales from a specific location vs company aggregation) or even global (e.g. our performance in the competitive landscape). We’ll get to such scenarios, in different application domains, in the future posts.