Playing in the data pond
/While talking about multiple data streams in the earlier posts of this series, we started using a term “data pond”. This is a concept we’re using internally in the context processing sets of streams, of the same or different types, that are usually somehow related - by source (e.g. a specific user or organization), domain (e.g. records from different patients) or processing requirements (e.g. data cannot be stored in cloud). Data ponds are very useful for simplification of data management, for example, in a basic scenario, adding a new stream to a project may require only dropping a file at a specific location. They are however also essential for analysis templates - sequences of transformations and analysis methods (generic or domain specific) that can be applied to streams in a pond.
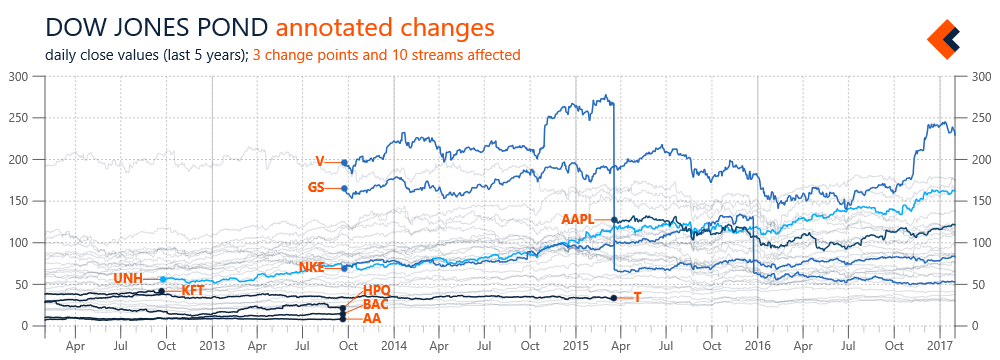
Figure 1 illustrates an example of streams automatically added to, and removed from, a data pond. Again, we’re using streams with daily close prices of Dow Jones components. In this case, information about changing the stocks included in Dow Jones are added to a definition of the pond and our framework automatically includes appropriate data streams, with applicable time constraints (so we don’t have to directly edit streams). However, the scope of a pond doesn’t need to be predefined; it can be also automatically determined based on availability of data streams in associated data sources. Monitoring the state of a pond can be further expanded with custom rules (e.g. tracking updates’ frequency) that result in chart annotations or notifications from the framework.
Figure 1 Overview of changes in the list of Dow Jones components with automated change annotations (SVG)
Data ponds are not only useful for data management, they are also relevant for analysis templates, which can be executed on individual streams or on a data pond as a whole. Analysis templates can be applied by default during the importing phase, and include normalization, error detection or input validation. They may also be executed conditionally, based on specific events or the nature of data streams. For example, the prices in Figure 1 were not processed, and the changes due to stock splits are clearly visible (see V or NKE). A stream with information about such events was added to a pond’s definition and used to trigger a template for all affected stocks. The result is a new series with split adjusted prices calculated for use in a chart with percentage changes (Figure 2).
Figure 2 Example of an analysis template automatically applied to calculating split adjusted stock price (SVG)
Data streams about Dow Jones components are obviously just a simple example, but this case study can be easily adopted to more practical applications like analysis of individual stock portfolio (with sells and buys defining the scope). We find data ponds, and visualizations based on them, useful in different scenarios and types of streams: records from multiple points of sale, results from repeated research experiments, and logs from hierarchically organized server nodes. Data ponds can be used to improve the management of input data, with detection of new streams and application of initial transformations, but also to give more control over the scope and context of a data analysis. This is especially important for long-term or continuous projects (e.g. building more complex models) and enables interesting scenarios like private analysis spaces, where specific requirements, including security, need to be met.


![Figure 2. Dow Jones background with value ranges normalized to [0,1] and Microsoft stock as the foreground (SVG)](https://images.squarespace-cdn.com/content/v1/52e0a367e4b0a7dd7b3beb3f/1481766174416-IHXTSGUSJ8WFTH7WERHI/sw-post09-image02.png)


![Figure 2. Dow Jones components with value ranges normalized to [0,1] and annotation artifact indicating minimum value of average for the whole set (big)](https://images.squarespace-cdn.com/content/v1/52e0a367e4b0a7dd7b3beb3f/1479865650146-LFQOKWZUTG4URJKV8GV8/sw-post08-image02.png)


